Income (chp 15)
Functional distribution of income is the way in which income is divided by economic functions.
|
Factor of Production |
Earnings |
Economic function |
Distribution of Income |
|
Labor |
Wages |
Compensation |
82% |
|
Entrepreneurship |
Profit |
Corporate profits |
9% |
|
Capital |
Interest |
Net interest |
9% |
|
Land |
Rent |
Rental income |
0.2% |
Per capita income
is the average income per person. In 2000, per capita income in the
The Lorenz Curve is a graph that show the amount of income inequality that exists in society.

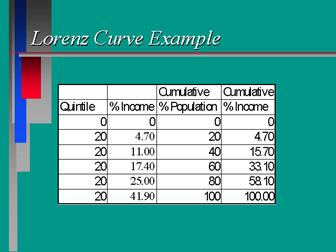 Each
segment of the pie chart represents 20% of the population. The largest portion
represents 41.9% of all income and the smallest represents 4.7%. If everything were
equal, each quintile (20%) of the population would have 20% of the income,
which is represented by the green line in the Lorenz Curve above.
Each
segment of the pie chart represents 20% of the population. The largest portion
represents 41.9% of all income and the smallest represents 4.7%. If everything were
equal, each quintile (20%) of the population would have 20% of the income,
which is represented by the green line in the Lorenz Curve above.
Poverty is the condition in which people do not have enough income to provide for their basic needs: food, clothing and shelter.
2001
HHS Poverty Guidelines
|
Size of Family Unit |
48 Contiguous States and D.C. |
|
|
|
1 |
$ 8,590 |
$10,730 |
$ 9,890 |
|
2 |
11,610 |
14,510 |
13,360 |
|
3 |
14,630 |
18,290 |
16,830 |
|
4 |
17,650 |
22,070 |
20,300 |
|
5 |
20,670 |
25,850 |
23,770 |
|
6 |
23,690 |
29,630 |
27,240 |
|
7 |
26,710 |
33,410 |
30,710 |
|
8 |
29,730 |
37,190 |
34,180 |
|
For each additional person,
add |
3,020 |
3,780 |
3,470 |
Those in poverty tend to 1. belong to a minority group, 2. have a female single parent, 3. not have high school diploma, 4. have a handicap, 5. live in a rural area, 6. have a family of 7 or more.
The causes of poverty include unemployment, low productivity and restrictions on job entries such as job discrimination or lack of skills.
Government Poverty Programs include (1) creation of jobs, (2) educational and re-training programs, and (3) income support programs (welfare).